Event Analytics & Reports

Data-Driven Event Intelligence

Real-time analytics across registrations, attendance, engagement, revenue, and sponsor ROI — with exportable dashboards, custom reports, and AI-powered insights.

Real-Time Dashboards50+ Report TemplatesAI Insights
1M+ data points processedTrusted by 400+ events
Real-Time Data Every metric updates live
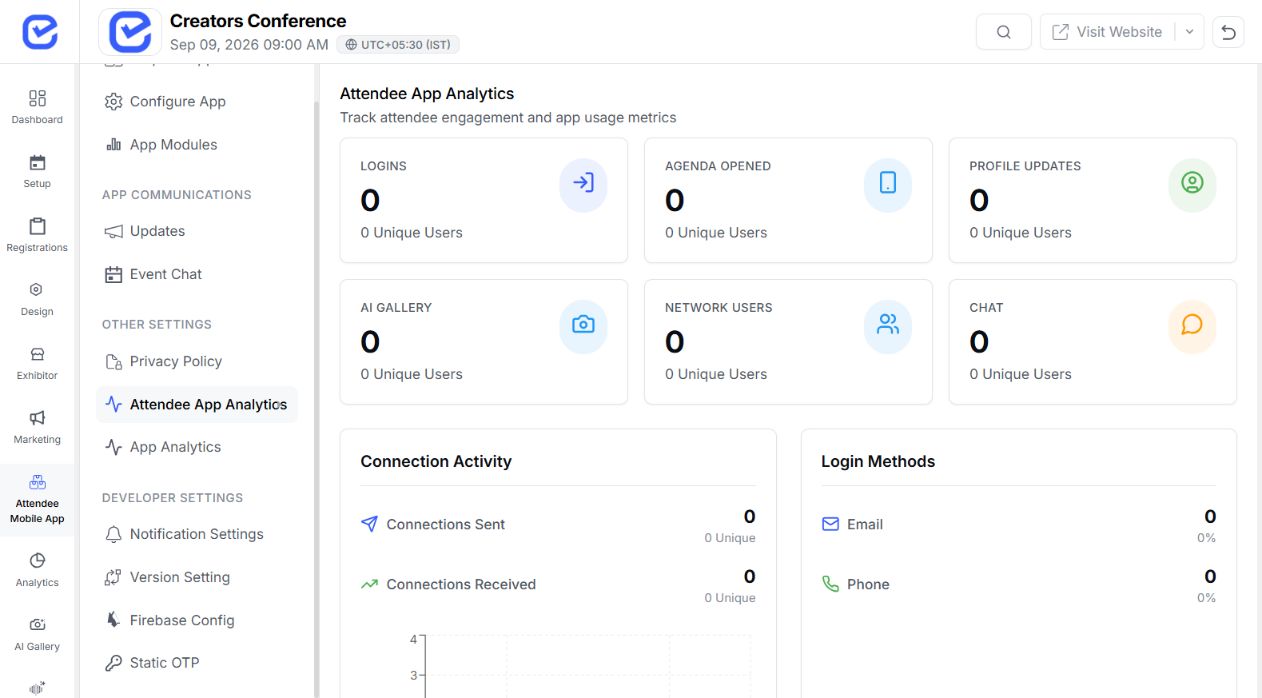
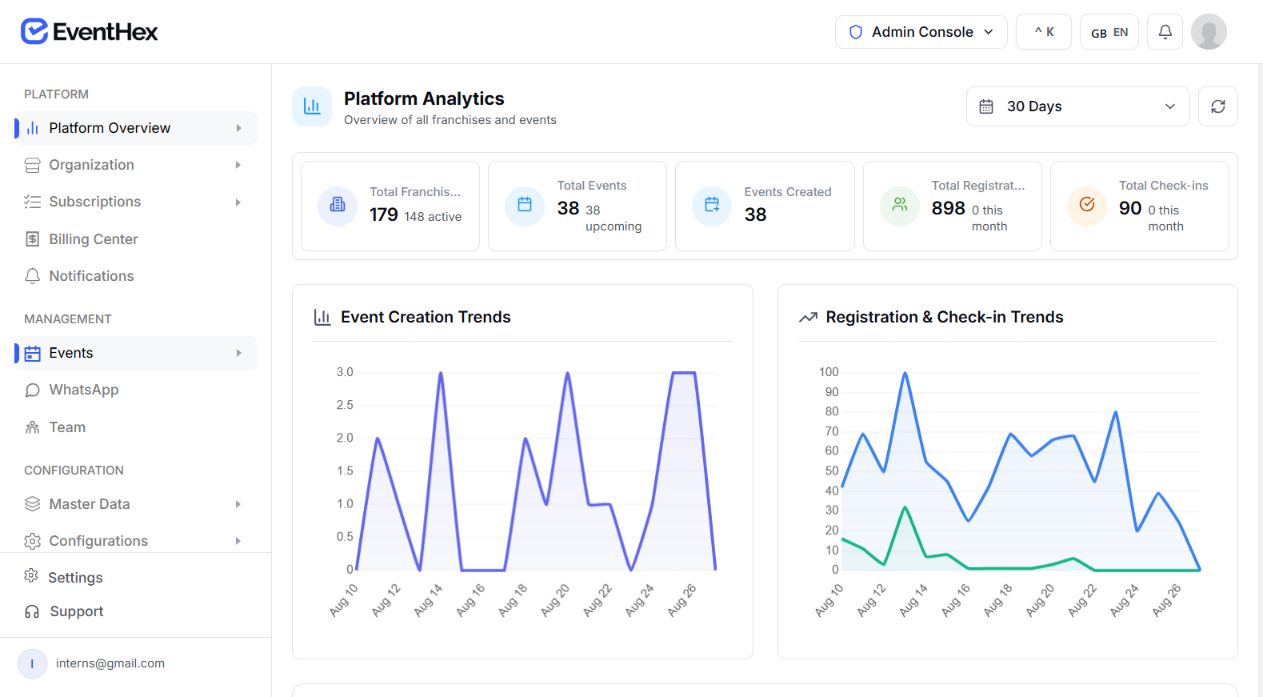
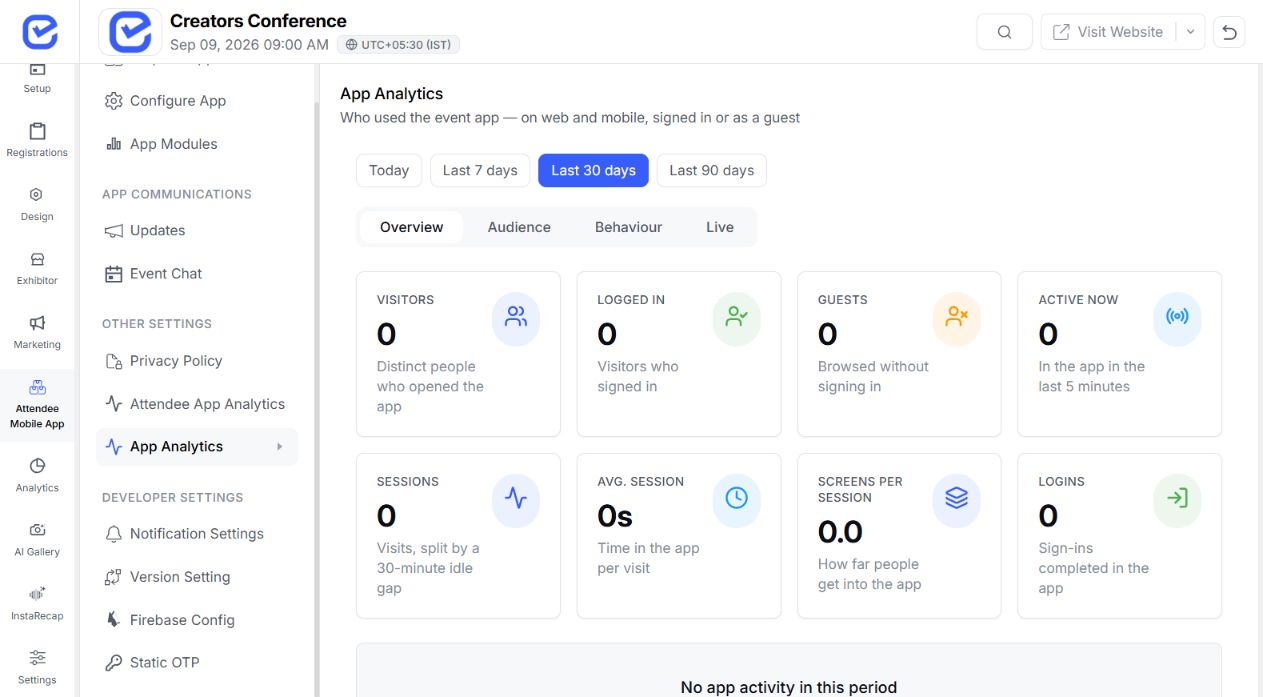
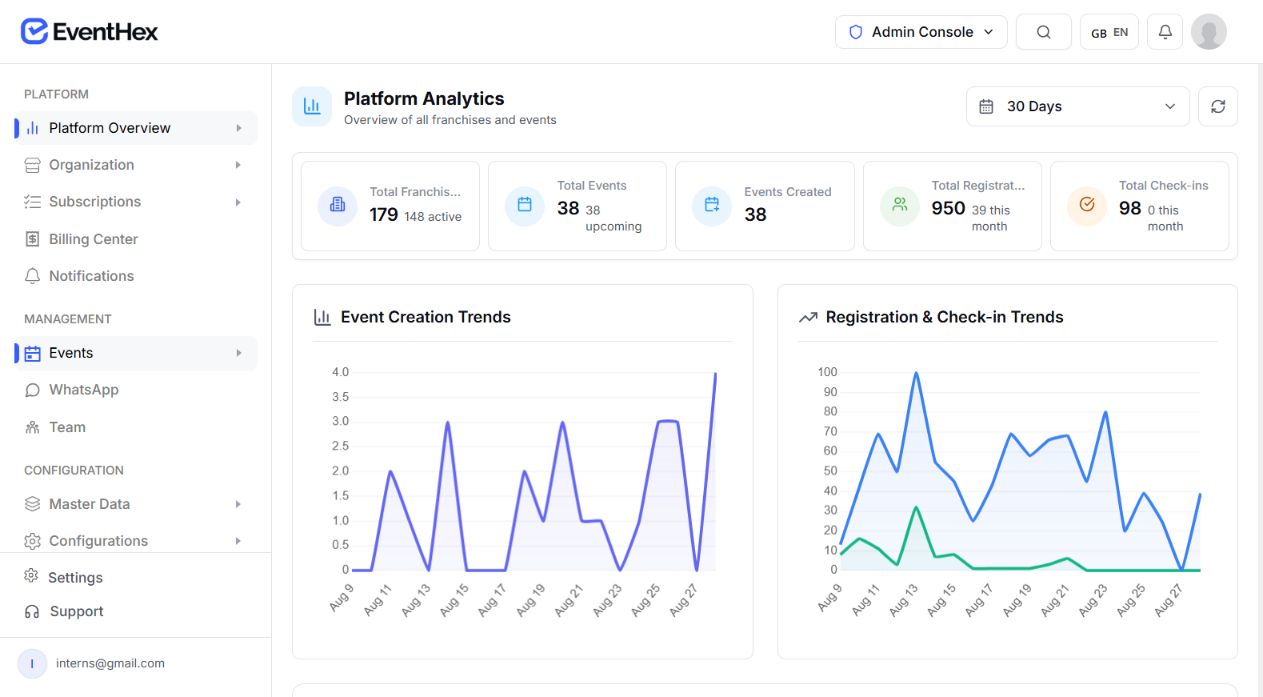
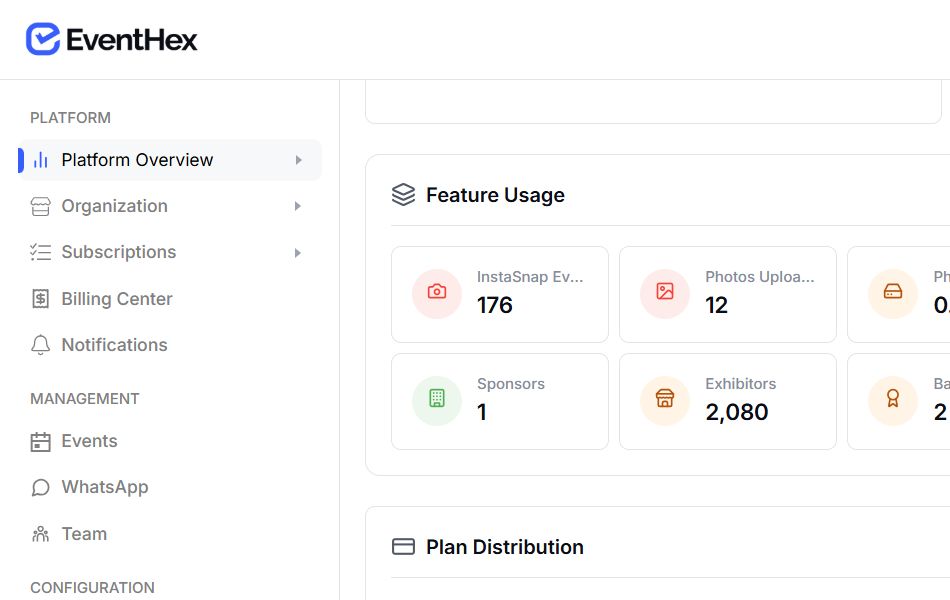
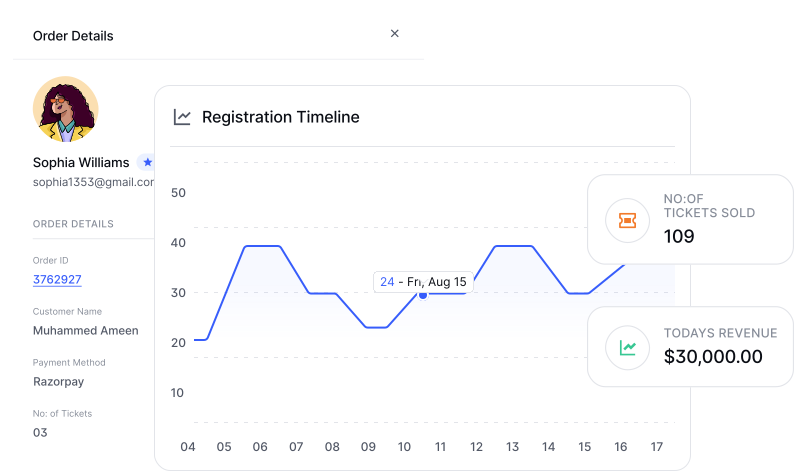
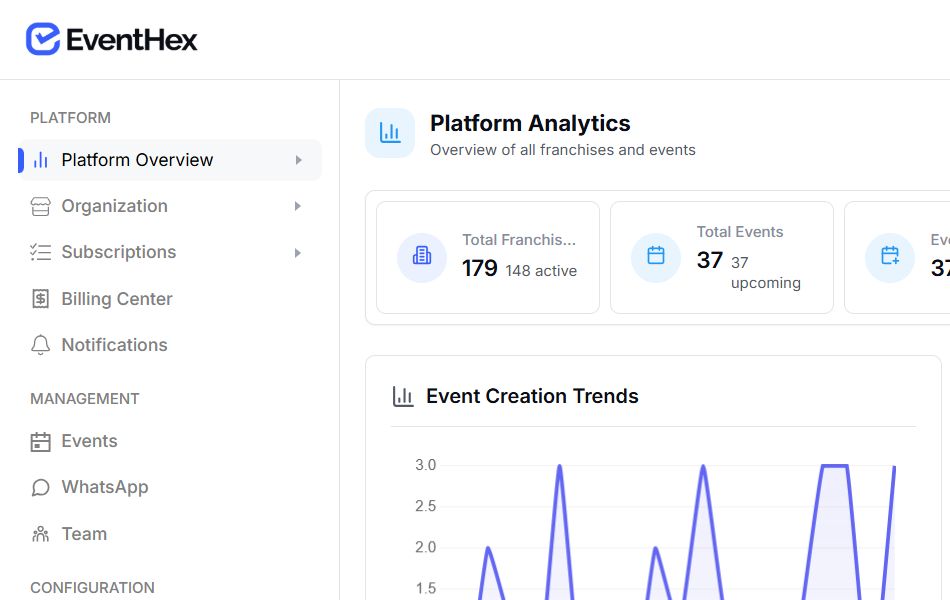
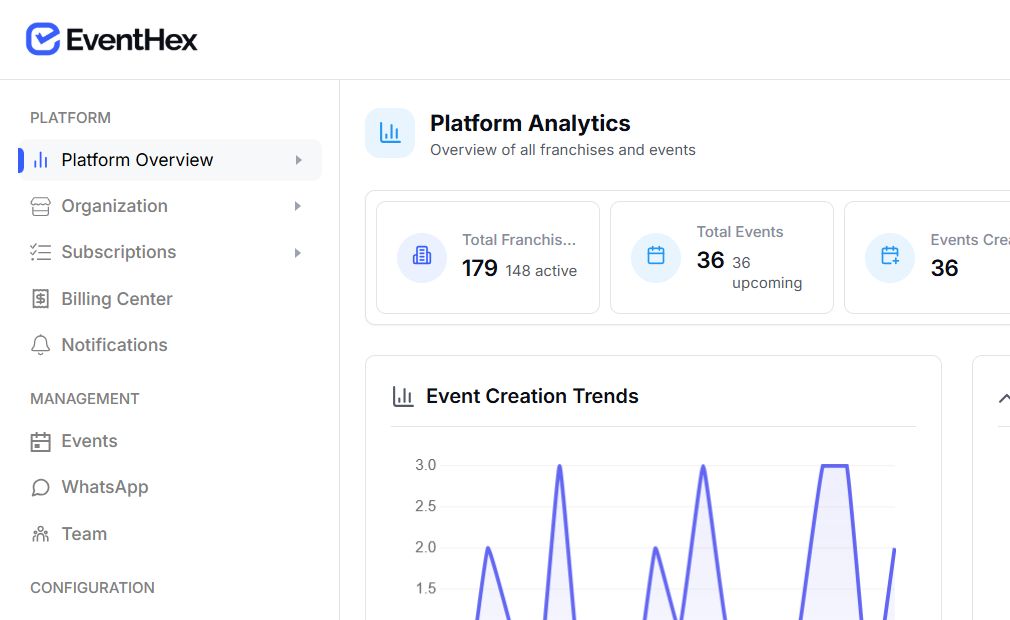
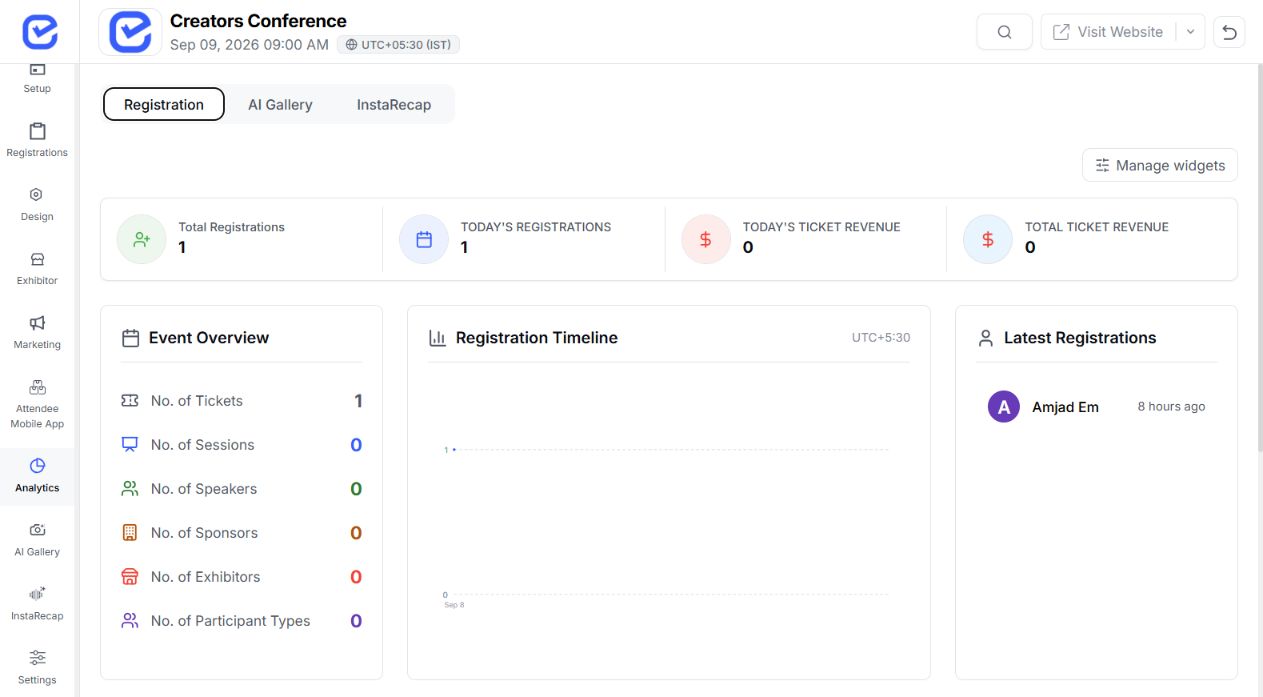
EventHex event analytics dashboard
AI Insights Predictive analytics and recommendations
50+ reports
1M+ data points
<5s load time

Analyze events with real-time dashboards and AI-powered insights

50+ Report Templates
1M+ Data Points Processed
< 5s Dashboard Load Time
4.8/5 Organizer Satisfaction

Event Metrics, Platform Analytics & Reports

Track registrations, attendance, engagement, revenue, and sponsor ROI from one analytics dashboard.

Registration, attendance, revenue & engagement in real time

Track signups, conversion funnels, ticket sales, check-in rates, session attendance, and composite engagement scores — all updating live.

2,480 73% $92k

Attendance Tracking

Live check-in tracking with arrival patterns and no-show rates.

847

Revenue Dashboard

Real-time revenue across tickets, add-ons, and sponsorships.

$

Session Analytics

Attendance, ratings, and engagement per session and speaker.

★4.8 ★4.6 ★4.9

Engagement Scores

Composite engagement scores for every attendee and session.

86

Multi-event comparison, cohort analysis & marketing attribution

Compare performance across all your events. Track returning attendees, measure marketing channels, and benchmark against industry data.

Event A · B · C

Cohort Analysis

Track returning attendees, first-timers, and VIPs across events.

UTM Tracking

Measure which marketing channels drive the most registrations.

Trend Analysis

Spot trends in attendance, revenue, and engagement over time.

Benchmark Data

Compare your event metrics against industry benchmarks.

AI Audience Insights

AI clusters attendees by designation and company, surfaces hidden segments, and enables semantic search across your attendee list.

Scheduled reports, custom builders & sponsor ROI with export

Use 50+ report templates or build custom reports. Schedule automatic delivery, generate sponsor ROI reports, and export via CSV, PDF, or API.

Scheduled

Custom Report Builder

Build custom reports with drag-and-drop metrics and filters.

Sponsor ROI Reports

Auto-generated reports showing sponsor engagement and booth traffic.

ROI 3.2x

CSV & PDF Export

Export any report or dashboard as CSV, PDF, or Excel.

CSV PDF

API Access

Pull analytics data into your own BI tools via REST API.

{ }
Everything you need to measure, analyze, and optimize event performance

Everything You Need to Track, Analyze, and Report
Event Performance

real-time

Live dashboards that update while your event runs

Registration velocity, check-in rates, session attendance, and revenue — all updating in real time. Spot trends and react to data as the event happens.

  • Every metric refreshes automatically
  • Directional trend lines for key metrics
  • Smart alerts when thresholds are breached
Explore More
2,847 registrations
92% check-in rate
+12% vs last hour
● Live dashboard
sponsor roi

Prove sponsorship value with verified data

Auto-generated sponsor reports with booth traffic, challenge participation, session attendance, and brand impressions — giving sponsors the ROI proof they need.

  • QR-verified booth visit tracking
  • Revenue impact and lead pipeline data
  • White-label branded sponsor reports
Explore More
342 Booth Visits
89% Engaged
3.2x ROI
✓ QR Verified
Sponsor report
ai insights

AI-powered predictions and smart recommendations

AI analyzes patterns across your events — predicting attendance, identifying engagement drivers, and recommending optimizations for your next event.

  • AI attendance and revenue forecasts
  • Smart recommendations for improvement
  • Hidden pattern detection in behavior data
Explore More
Prediction +18% attendance expected
Recommendation Schedule keynote at 10am
AI insights
data export

Export everything for your own analysis tools

Export any dashboard or report as CSV, PDF, or Excel. Pull data via REST API into Tableau, Power BI, or Google Data Studio.

  • CSV, PDF, and Excel export
  • REST API for BI tool integration
  • Scheduled auto-delivery to stakeholders
Explore More
📄 CSV
📋 PDF
📊 Excel
API
GET /api/v1/export
🕑 Auto-delivery: Weekly
Export options
How Event Analytics Works

From Raw Data to Actionable Intelligence

Connect your event data, monitor live dashboards, generate reports, and get AI-powered insights.

01

Connect Your Data

Analytics automatically pulls data from registrations, check-ins, sessions, feedback, and all event activities.

02

Monitor Live Dashboards

Watch real-time metrics during your event — attendance, engagement, and revenue updating every second.

03

Generate Reports

Use report templates or build custom reports. Schedule automatic delivery to stakeholders and sponsors.

04

Get AI Insights

AI analyzes patterns across events and recommends optimizations for future planning.

Make Data-Driven Decisions

Ready to Transform Raw Event Data Into Intelligence?

See how EventHex analytics gives you real-time dashboards, sponsor ROI reports, and AI-powered insights.

Real-time dashboards AI insights Free onboarding support
No credit card required Free onboarding support Cancel anytime
Why Event Organizers Choose EventHex Analytics

Complete Event Intelligence Platform

Track every metric, prove sponsor ROI, and get AI-powered recommendations from one analytics hub.

Real-time event dashboards

Live metrics that update every second across registrations, attendance, and revenue.

Sponsor ROI analytics

Auto-generated sponsor engagement reports with QR-verified booth traffic data.

AI-powered insights

Predictive analytics, smart recommendations, and hidden pattern detection.

Need help with event analytics?

Frequently Asked Questions

We help event teams set up dashboards, reports, and AI analytics tailored to their event data and stakeholder needs.

Talk to Our Team

Our experts can walk you through a personalized demo and answer any questions.

Book a Demo
What data is tracked by EventHex analytics?

Everything — registrations, ticket sales, check-ins, attendance per session, engagement metrics (polls, Q&A, gamification), sponsor booth traffic, revenue, and post-event feedback.

Can I create custom reports?

Yes. The custom report builder lets you select specific metrics, apply filters (date range, ticket type, attendee segment), and save report templates for recurring use.

Can analytics data be exported?

Yes. Export any dashboard or report as CSV, PDF, or Excel. You can also pull data via REST API into your own BI tools like Tableau, Power BI, or Google Data Studio.

Are analytics available in real time?

Yes. Dashboards update in real time during events — registration velocity, check-in rates, session attendance, and revenue all refresh automatically every few seconds.

Can I compare multiple events?

Yes. The multi-event dashboard lets you compare registration trends, attendance, engagement, and revenue across all your events side by side.

How does AI improve analytics?

AI analyzes data patterns across events — predicting attendance, identifying what drives engagement, flagging anomalies, and recommending specific improvements for your next event.